Data Analysis
The Data Analysis option provides access to various features that help you report on the information captured and stored in ServicePRO database. You have an option to create raw queries to mine data and export results to excel or other format for further analysis. ServicePRO also provides out of the box canned standard reports which can be further customized to suit your business requirements.
Interactive User Interface
To access Data Analysis functions in the Interactive user interface:- Open the Backstage Menu, and select the Analytics tab
- Access them via Charts Tiles or Query Tiles to the Home Page.
Workbench User Interface
To access Data Analysis functions in the Workbench user interface, select the Data Analysis Icon from the Workbench.
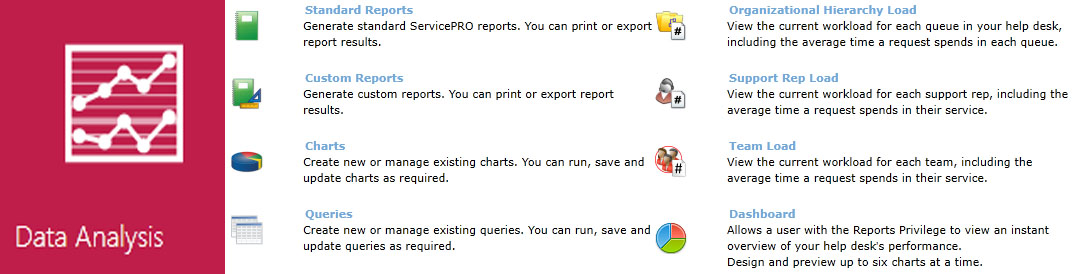
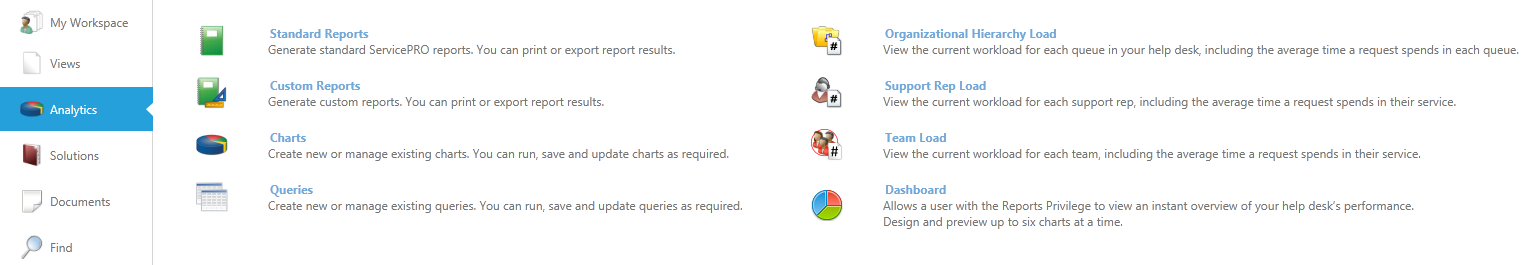
Pages in this Section
| Charts | Dashboard |
|---|
What? Charts and the Dashboard are a set of powerful and intuitive tools designed to create engaging and informative charts. The visual Chart Designer allows users to quickly specify data fields and groups, filters, along with many other parameters. Several chart types are available including Bar, Pie, Line, and Area.
Why? There are times when a visual representation of data can be more insightful than a report to identify trends and relationships.
| Reports | Legacy Reports |
|---|
What? Standard reports allows you to view a library of standard reports that helps you to examine the current state of your application, measure historical performance and identify trends and weaknesses of your application.
The Custom Report Designer makes it quick and easy to specify precise data types and fields. Grouping levels, header/footer, and general report layout are seamlessly integrated through the intuitive user interface.
Why? This information effectively allows management to analyze how the Help Desk is functioning and plan for future needs. For instance, managers can generate timely reports pertaining to Service Level Agreements (SLAs) so that any pending problems can resolved before any SLAs are compromised.
| Queries |
|---|
What? Query Designer allows quick and flexible data analysis in tabular format. As with all ServicePRO® reporting, filters and constraints are easily implemented. Query Designer allows users to obtain a precise snapshot view of a particular dataset that meets a specified criteria.
Why? Sometimes there may be a need to get some insight into certain information but which does not require a full blown report. Query designer can produce a quick list of a specific criteria and display any fields relevant in a tabular format.
| Loads |
|---|
What? Workload module allows you to view the current workload for each Queue, Team, and Support Rep in your application.
Why? Workload management is important for analyzing the current workload for user team and department to determine proper resource allocation and utilization.
| Criteria Options for Rules and Reports |
|---|