Auto Discovery
Overview
With Auto Discovery, users can configure a discovery audit to gather information about the workstation's hardware and software. Using the Network Audit Engine, you can remotely collect detailed hardware and software information about the machines and devices on the networks you manage. This information will then be automatically stored in the ServicePRO database.The Audit Service audits Windows, Linux and MAC machines and also devices such as Printers, Routers, Switches, Firewalls, UPS or Temperature Controls that are on the network. For auditing Windows Machines, the service uses Windows Management Instrumentation (WMI), which is built into the Windows® operating system. For auditing non-Windows Machines (Linux, MAC) and the devices, the service uses SNMP (Simple Network Management Protocol) Discovery.
Simple Network Management Protocol
Simple Network Management Protocol is an "Internet-standard protocol for managing devices on IP networks". Devices that typically support SNMP include routers, switches, servers, workstations, printers, modem racks and more. SNMP is a protocol used by many hardware vendors that allows third-party apps to interact with the hardware in singular fashion.The application protocol for ServicePRO Network Audit uses the open source .NET library, SNMPSharpNet. At this time, SNMP v1 and v2 are supported, while SNMP v3 is unsupported.
Ribbon Toolbar
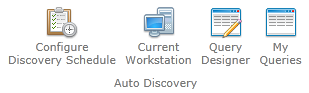
The Ribbon Toolbar features one task group with four options:- Configure Discovery Schedule
- Current Workstation
- Query Designer
- My Queries
Network Audit Service
The Audit Service component can remotely audit the following devices and Operating Systems on the network:
- 64 bit & 32 bit Windows OS – Installed software of both 32 bit & 64 bit
- Linux OS, Mac OS, All Devices including Printers, Routers, Switches, Firewalls, UPS, Temperature Controls, etc. for which SNMP signatures are configured.
Furthermore, the service imports the audited information (generated by the discovery agent) into the Scan folder (default C:\HelpSTAR\HLPSTRCS\SCAN) for the machines that are not in a trusted domain. The discovery agent, which uses a Login Script deployment, scans the current machine and prepares a .dat file, then sends a push notification to the Audit Service to have the data imported to a database.
Machines are uniquely identified by using the Workstation Name and MAC Address.
Network Audit Service Requirements:
- .NET framework 4.6.1 (or higher) is required for installing/configuring the new Discovery Service.
- The Service should be running under a domain administrator.
For WMI based Auditing
- Firewalls should be configured for WMI
- For more information, read: https://msdn.microsoft.com/en-us/library/aa389286(v=vs.85).aspx
- Remote Registry Service should be enabled on the machine in order to audit it
- For more information, read: http://esupport.trendmicro.com/solution/en-US/1039259.aspx
For ServicePRO Discovery
- Administrators need to enable and configure SNMP on all the MAC machines, LINUX machines and the devices that needs to be audited.
- Any Machine/device that support SNMP can be audited by Discovery Service
- User needs to configure SNMP signature in ServicePRO before the service can audit the SNMP based machine
- Device OID is required in order to audit the machine
- Community name for auditing SNMP bases device should be “public”
- For getting the OID from a device, “SnmpB” tool can be used
- For configuring SNMP on MAC type the command below on the terminal and follow the following instructions:
(sudo snmpconf -g basic_setup)
Settings required from ServicePRO application
- Network Audit service for performing remote scan requires configuring a discovery schedule from the ServicePRO application.
- The ServicePRO Manage SNMP function is used for configuring the fingerprint for the information that you want to capture for the specific devices, Linux and Mac machines.
- For more information on this subject: Manage SNMP Signature in ServicePRO.
Configure Discovery Schedule
To audit network machines, you first need to configure and schedule the Audit Service. When the scheduled time arrives, the Audit Service will start scanning the machines specified in the configuration.
Ribbon Toolbar
The Ribbon Toolbar has been divided into categories for performing specific tasks. Options are often context sensitive, and can be used upon selecting a Discovery Schedule Configuration.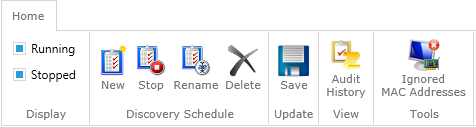
Display
Choose to filter out Discovery schedules by their status.
- Running
- Stopped
Discovery Schedule
- New- Create a new Discovery Schedule.
- Stop/Start- Stop a running Discovery Schedule, or Start a Discovery Schedule, depending on the selected schedule's current status. Stopped schedules are faded out in the Discovery Schedule Configuration list.
- Rename- Rename a Discovery Schedule.
- Delete - Delete a Discovery Schedule.
Update
- Save- Save any changes made to a selected Discovery Schedule Configuration.
View
- Audit History - View a history of audits for all available machines or specific workstations. A total record count is also noted in this window. Users can narrow search history by the following criteria:
- Machine Name or IP
- Discovery Schedule
- Start/End Date
- Audit Status
Tools
- Ignored MAC Addresses - Audit service will skip all MAC addresses provided in this list when checking if the machine already exists.
Using Configure Discovery Schedule
To begin using Configure Discovery Schedule:
- From the Auto Discovery tab, click on the Configure Discovery Schedule icon.
- Click on the New icon in the Discovery Schedule task group.
- In the General work area, give the audit a name and enter a brief description.
- In the Schedule work area, indicate how frequently the audit will run.
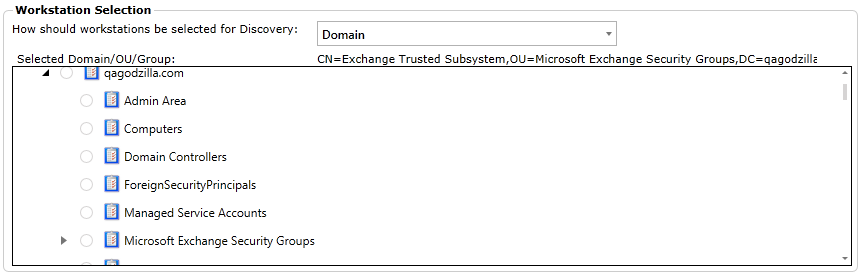
- In the Workstation Selection work area, choose how the workstations will be selected for discovery. The drop-down list contains the following choices:
- Close the window. You will be prompted to save your settings. Repeat the process to schedule separate settings for different groups of machines.
- Your new discovery schedule configuration will be active by default (that is, the audit service will scan the workstations according to the schedule you have set). To stop a specific configuration schedule, select it and click the Stop button. To restart a paused schedule, click the Start button.
IP Range — The window refreshes and displays an entry field for specifying the IP Range of the machines you want to scan.
You can document the discovered software to associate it with the software products in your ServicePRO database. This will allow you to check your software License Compliance.
Domain Workstation Selection Mode
In ‘Domain’ workstation selection mode, Users will be able to make only one selection for Discovery Schedule configuration:
- A Domain
- An Organizational Unit
- A Group
Domain tree nodes will be templated with a radio button to select. Only one selection is allowed as described above.
IP Range Workstation Selection Mode
Using this mode, Users can scan for workstations between set ranges of IPs.
Class A, Class B and Class C IP ranges will be accepted for entry. However, IPs specified in a range must be in the same class.
IP addresses cannot be either Class D or E.
As of November 2015, the exiting schedules will stop functioning after upgrading to the latest version of ServicePRO. Clients should be advised to update all existing Discovery Schedules configured using the ‘Domain Tree’ workstation selection mode.
Audit by Domain Tree
- When the user selects a domain as the type of the audit, the checkbox "Allow to scan SNMP devices" will become visible and checked.
- When the user selects a Domain (DC) in the domain tree, the checkbox will remain checked.
- When the user selects an Organization Unit or Company, the check box will be unchecked; users can choose to check it again if needed.
- If the checkbox is checked, SNMP devices in the entire domain will be discovered/scanned as well.
- If the checkbox is unchecked, the SNMP devices in the domain will not be discovered/scanned.
Audit By Login Script
Machines that are not in a trusted domain can be audited from a login script. Note that this topic refers to auditing with WMI technology, which will scan for hardware configuration and installed software.
In order to audit machines that are not in a trusted domain, they must be able to connect to the workstation hosting your ServicePRO network installation. The audit script must be configured so that the first part points to the executable file "HdtcAudit.exe" that will audit the workstation, and the second part points to the "Scan" folder where the audited data will be written to an dat file. In the following examples of login scripts, the mapped drive "T" hosts the ServicePRO network installation.
- ServicePRO for SQL: Start T:\HS2008\Hlpstrcs\Scan\ DiscoveryAgent \HdtcAudit.exe /Path:T:\HelpSTAR\ Hlpstrcs\Scan
You must configure the Network Audit Service to scan the audited data in the dat file created by "HdtcAudit.exe". To do this you must edit a value in the file " ServicePRO.Discovery.Service.exe.config", which is located in the "AuditService" directory on the machine where you Installed the Network Audit Service – e.g. C:\HelpSTAR\HLPSTRCS\Modules\AuditService. Open this file in Notepad and locate the following line:
add key="hsFileScan" value="0"/
Change the value to "1" to enable the file scan function. Now the Network Audit Service will scan the dat file for new audited data.
File Scan is by push notification, and not by polling. As a result, as soon as the file is ready in the file scan path configured, the Discovery Service will scan the file for audited information and import the data.
Auditing a Standalone Computer
You can also use the HdtcAudit.exe file to audit a standalone machine.- Copy the DiscoveryAgent.Zip folder from your AuditService install path(e.g. C:\HelpSTAR\HLPSTRCS\Modules\AuditService) to a portable device like a USB drive.
- Extract the folder and insert it in the standalone computer.
- From this machine, locate the file and double-click on it to start the audit. The audit will take a few minutes for the audit to finish as it runs in the background.
- When the audit is completed, a dat file will be generated in the same folder where HdtcAudit.exe is located. This file will be named after the audited computer – e.g. machinename.dat.
- Copy this file to the \Scan folder(e.g. C:\HelpSTAR\HLPSTRCS\SCAN) in your ServicePRO network installation. The audited data will be imported into ServicePRO the next time the Network Audit Service runs.
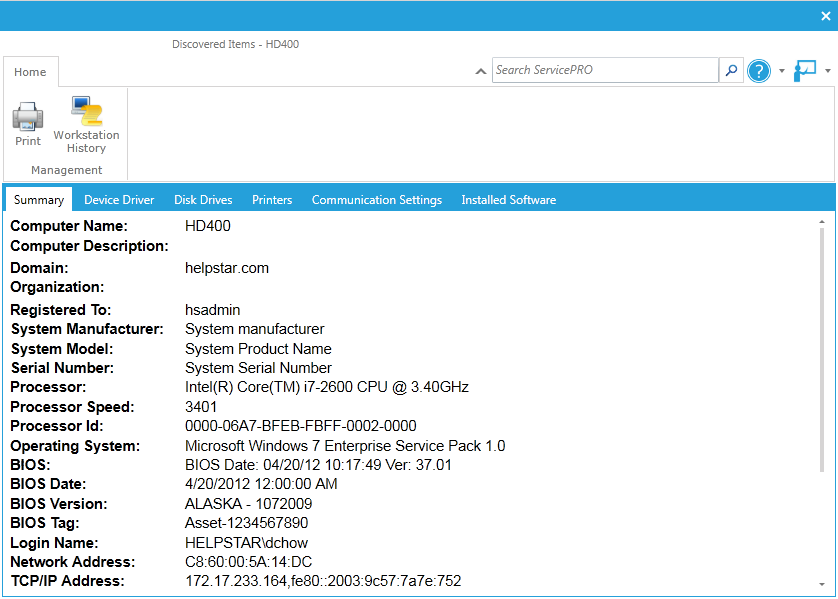
Current Workstation
Select the Current Workstation icon to run an audit on at the workstation where you are currently logged in. This audit identifies and displays all hardware and software currently installed on your workstation.When the audit completes, the Discovered Items window appears, as shown below, displaying the audit results for your machine. The following information is provided in these results:
- Summary — This page lists general information regarding your workstation such as computer name, processor speed, operating system, and IP Address.
- Device Driver — This page lists all devices connected to your system along with their information; similar to Window’s Device Manager.
- Disc Drives — This page displays the disk drives (local and network) accessible from your computer.
- Printers — This page displays all printer devices installed on your workstation.
- Communication Settings — This page displays information about your communication ports.
- Installed Software — This page displays all software installed on your workstation.
Current Workstation – Ribbon Toolbar
The Ribbon Toolbar features the following options under the Management Task Group:- Print – When you select this button, you will be prompted to select which audited sections you would like to preview before printing (shown below): Once you select the preferred options, click the Preview button to see a preview of the file before it prints.
- Workstation History – You have the option to specify a workstation asset when logging a request via the “Item” field of a request. Selecting this option will list all requests where this workstation was specified in the asset field. This is beneficial is determining the amount of maintenance/support a workstation has required.
Audit Current Workstation Function in ServicePRO & ServicePRO Web
- This function will use the HDTCAudit component
- Users can click an icon to download the HDTCAudit component to local machine
- In ServicePRO, the downloaded HDTCAudit executable can be launched from the application in order to start scanning and writing the .dat file
- In ServicePRO Web, the user will be asked to run the downloaded HDTCAudit component manually in order to scan and prepare the .dat file
Query Designer
Select the Query Designer to open the Discovered Items Property window from the Auto Discovery Tab. Here you can create a specific Query for assets to be discovered.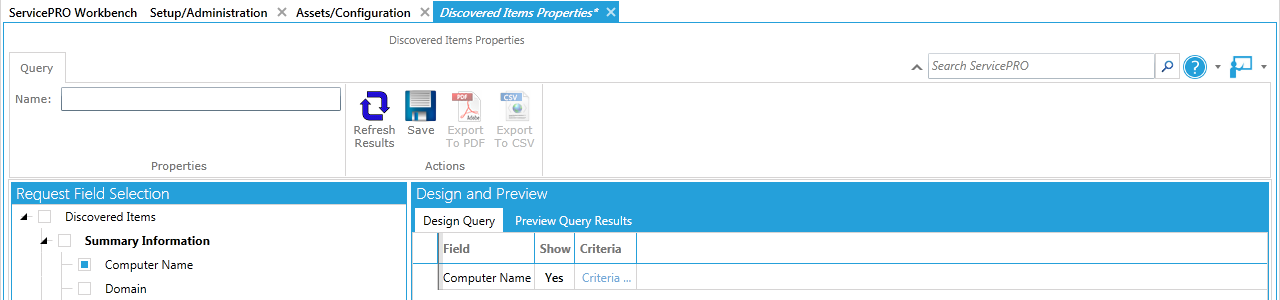
- From the Assets/Configuration page, go to the Auto Discovery task group and click on the Query Designer icon. The Discovered Items Properties window opens as shown below. Use this window to create a custom query to filter and view information regarding items discovered in an audit.
- From the Request Field Selection tree view, click on the fields you would like your query to filter, as shown in the figure below.
- The Design and Preview work area contains two pages: Design Query and Preview Query Results.
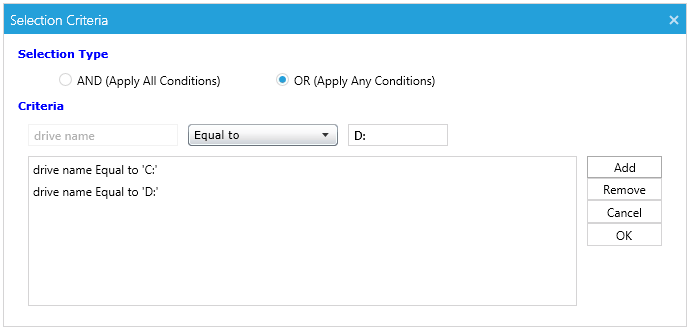
- On the Design Query page, click on the desired filed in the Criteria column to define criteria for the request field item. The Selection Criteria window opens as shown in the figure below.
- Enter the criteria for your query.
 Query Designer
 - In the Selection Type work area, click on the And or Or radio button to select the operator you want to use to combine your search strings. In the example in the figure above, the query will find all the Drives with the name “C:” OR “D:”
- Click on the OK button.
- Click on the Preview Query Results page to view all items matching your query.
Ribbon Toolbar
Under Actions, you can then perform one of the functions listed below:- Name – Set the name for the Query
- Refresh Results – Refresh the results of the current Query
- Save – Save the Query
- Export to PDF – Export the Query in PDF format
- Export to CSV – Export the Query in CSV format
- Grouped – Exported CSVs will display Discovered Item Queries in a table that emulates the layout used in ServicePRO.
- Linear – Linear CSV export will arrange all device property columns horizontally, in a single table format.
Request Field Selection Pane
In this pane, select checkboxes for corresponding fields to be displayed in the Design pane. Each Field contains different Criteria.Design and Preview Pane
This pane displays Queries for Discovered Item searching, based on fields checked off in the Request Field selection. It contains two tabs:- Design Query Tab
- Preview Query Results Tab
My Queries
From the Assets/Configuration page, go to the Auto Discovery task group and click on the My Queries icon to open the Query Listing window, as shown below. This window helps you create new, run, update, or delete an existing discovered item query.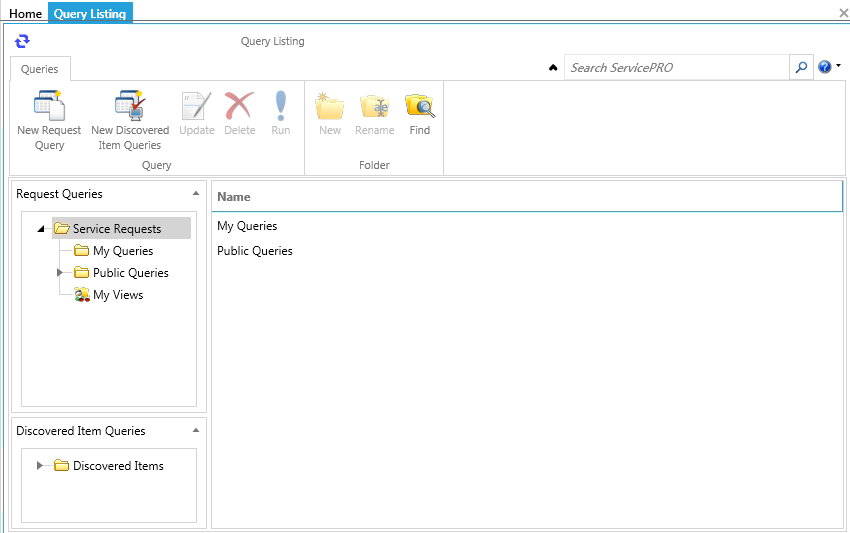
Notes on Discovered Hardware
Asset Creation
- When Assets are created by dragging from the Discovered Hardware window, or using the right-click context menu, assets will be created in the Asset Tree. When users “clear associations” with the asset tree, the item will be added to the Discovered Hardware section, and removed from the Asset Tree.
- Assets will default to the “Hardware” custom Type if the asset is created from Discovered Hardware types other than workstations. Users will be able to change the asset type based on preferences, but the asset will still maintain its association with the Discovered Hardware.
- When updating assets created from Discovered Hardware types that are not workstations, the application will not clear the association with the Discovered Hardware when changing UDF types.
- Users can clear Discovered Hardware associations of assets by selecting the “Clear Association” option from the Discovered Hardware user interface.
- Asset Custom Field types cannot be deleted from the object designer if it is associated with any discovered hardware. Users will be notified if any associations are present when attempting to delete these Custom Types from the Custom Object Designer.