Loads
Return to Data Analysis
Organizational Hierarchy Load
From the Interactive homepage, click on the ServicePRO button, select the Analytics option and click on the Organizational Hierarchy Load icon to view the current workload for each queue. For each queue folder, the numbers of Active, Scheduled, Suspended and Waiting for Response requests that are in "In Queue" Status are shown, along with the Average Time in Queue. The Average time in queue helps to assess which folders may need restructuring in terms of process improvement or additional resource allocation.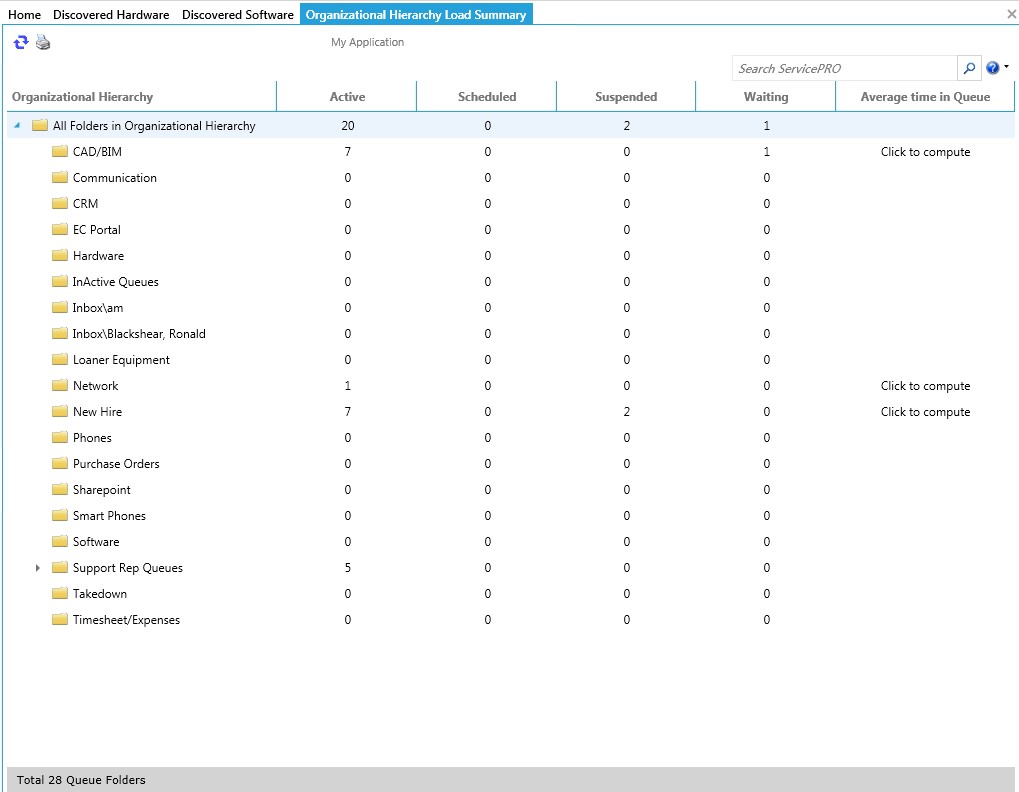
Queue Load Summary
Support Rep Load
From the Interactive homepage, click on the ServicePRO button, select the Analytics option and click on the Support Rep Load icon to view the current workload including the average time that requests spend in the Rep’s service. For each Support Rep, the number of Active, Scheduled, Suspended and Waiting for Response requests that are "In Service" is shown, along with the Average Time in Service. You can use this option to assess how a Support Rep is performing and if they are able to address the requests assigned to them on time.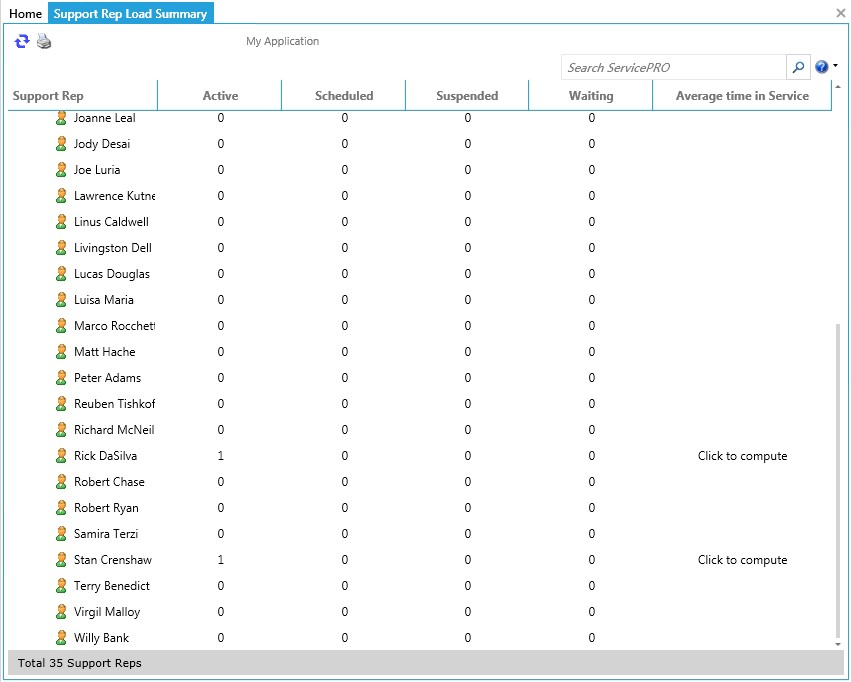
Support Rep Load Summary
Team Load
From the Interactive homepage, click on the ServicePRO button, select the Analytics option and click on the Team Load icon to view the current workload for each Team, including the average time that requests spend in the Team’s service. For each Team, the number of Active, Scheduled, Suspended and Waiting for Response requests is shown, along with the Average Time in Service for that team. You can use this option to assess how a team is performing and if they are able to address the requests assigned to them on time and where improvements could be made.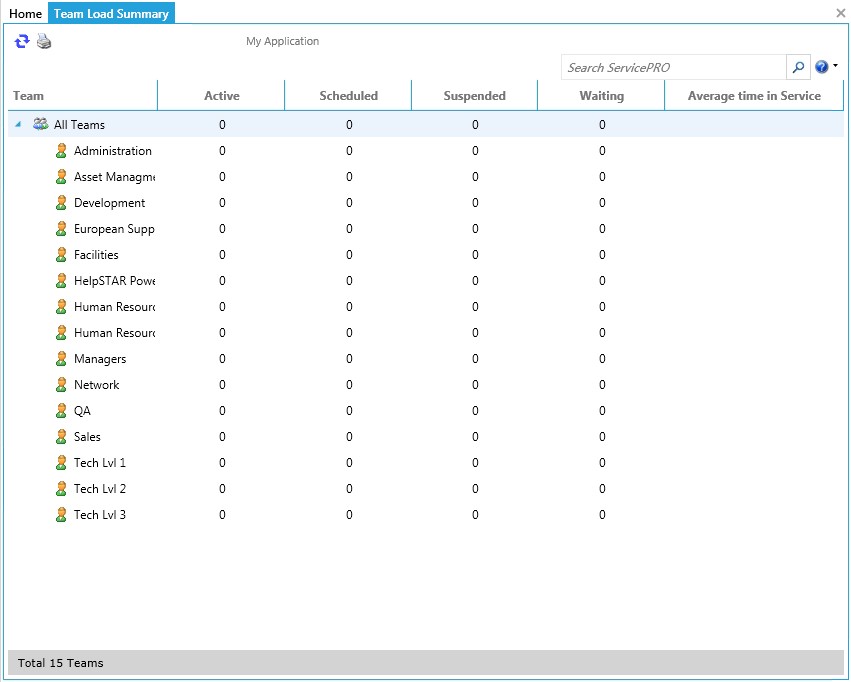
Team Load Summary