Dashboard
Return to Data Analysis
Dashboard
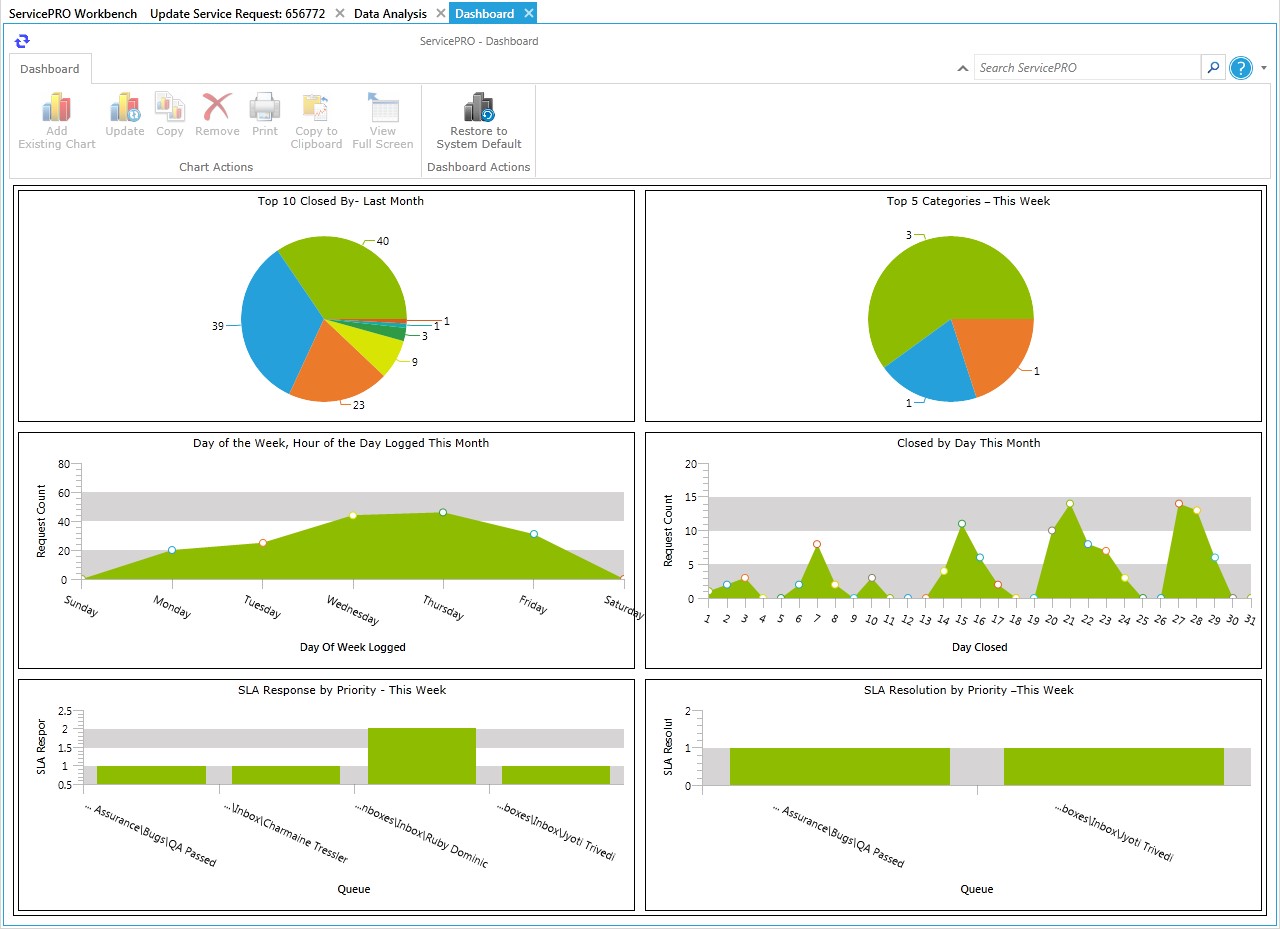
The dashboard is a selection of charts that provide an instant overview of Service Desk performance. A typical dashboard looks similar to the example shown in the figure below. Users must have “Data Analysis” Roles to access the Dashboard.Use the Dashboard Designer to select the charts that you want to appear on your dashboard and to configure the conditions for displaying data on each chart.
Dashboard can be accessed by selecting Data Analysis from the Workbench, and selecting Dashboard.
Dashboard
There are predefined charts in the application which can be selected to be displayed, or the user can create their own charts with the opportunities offered in the Chart Designer. As previously mentioned; Charts can be saved as Public or Private. Public Charts will be available for all the users, while private will only available for the specific user.
Dashboard Toolbar
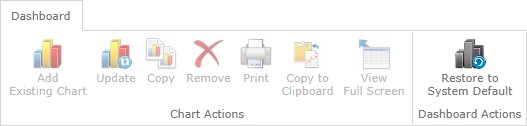
Chart Actions Group
- Add Existing Chart - Select a Chart (Public or Private) to be displayed in the Dashboard. This option can only be selected if one of the Chart slots is empty.
- Update - Takes the user to the Chart Designer, where the user can edit the chart.
- Copy - Copies a Chart to an empty Chart pane.
- Remove - Deletes the Chart from the select area in the Dashboard
- Print - Prints the selected Chart
- Copy to Clipboard - Copy the selected Chart in the Dashboard to the Clipboard
- View Full Screen - View a full Dashboard version of the chart selected.
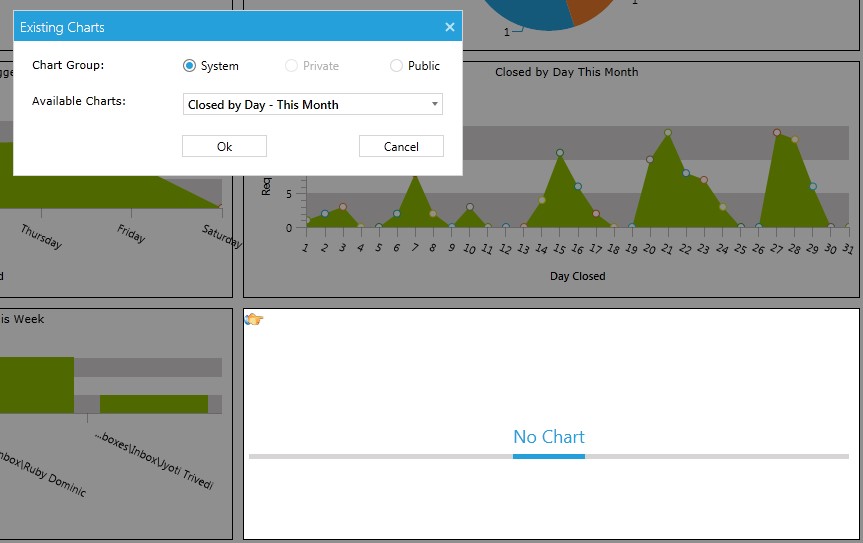
Existing Charts Pop-Up Window